Two-Body Problems and Graphical Analysis
Reference > Science > Physics > Study Guide > Unit 1: Kinematics - Motion in One DirectionProblems Involving Two Bodies
Frequently a problem will be given which involves the motion of two objects with different speeds, accelerations, starting points, starting times and etc. These objects will then move until one of them catches or meets the other. Since each problem of this type will be different it is difficult to give concrete rules regarding their solution. However, the following suggestions may give you some help in attacking the problems. List everything known about the motion of the objects. You will need a separate list for each object. Frequently it will be necessary to give a quantity for one object in terms of the same quantity for the other. For example, if the problem involved a car catching up with another car which had a head start of 500 ft you might give ΔX for one car as Z and ΔX for the other as Z + 500. You may need to express more than one variable this way. After listing all known quantities and expressing all unknown quantities as variables you should start writing equations. You may end with a set of simultaneous equations which you solve using algebra. Again you learn best by doing it. Study the following examples and then work on assigned problems.
Sample Problem #1
Two boys are in a bicycle race. John can accelerate with a constant acceleration of 0.5(a) Find how long before Paul catches John.
(b) Calculate the speed of both riders when Paul catches John.
(c) How far do they travel before Paul catches John?
Sample Solution #1
Note that this time we have expressed the two unknowns by variables. Use equation 5 to express the distance traveled by both John and Paul in terms of a and t. Then solve the set of equations you get for T and Z.
For Paul Z=
Graphical Analysis
Frequently a graph can be a useful tool in studying the motion of an object. The graphs do not always need to be constructed. Often a good sketch will help in the analysis of the motion. The two graphs which are generally most likely to be useful are graphs of position vs. time or speed vs. time. The following facts should be kept in mind:
- In a position vs. time graph the slope of the line at any point represents the speed at that instant.
- In a speed vs. time graph the slope of the line at any point represents the acceleration of the object at that instant.
- In a graph of speed vs. time the area between the line and the time (horizontal) axis between two points is the distance traveled by the object between those two times.
- In an acceleration vs. time graph the area between the line and the time axis is between two points is the change in speed during that time interval. The use of graphs in solving problems is shown in the problems below. Study these problems carefully and be alert for places in your problem solving where these techniques can be helpful.
Sample Problem #2
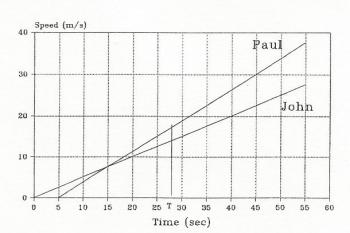
Represent the motion of the two boys in problem 7 by graphs and use the graphs to solve the problem.
Sample Solution #2
The most useful graph is frequently the graph of speed vs. time since both acceleration, speed and displacement can be obtained from it. Sketch a graph showing the motion of both objects on the same set of axes.

Figure 1.4.1
Study Figure 1.4.1 carefully. The line representing John's motion has a constant slope of 0.5Note that this is the same equation which was obtained by different reasoning the first time we solved this problem. The rest of the problem proceeds much as before. We really have introduced nothing new but have only shown a different way of seeing the motion.
Sample Problem #3
You have a car which can accelerate from 0 to 60 mph (88(a) how long will it take you to catch the other car?
(b) how far will you have gone?
Sample Solution #3
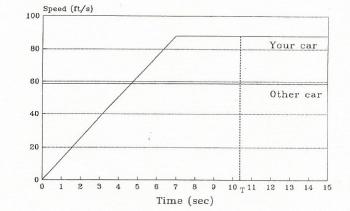
It is probably best in a problem such as this to express all speeds and distances inThe motion of the two cars is shown in Figure 1.4.2.

FIGURE 1.4.2
Please note that this problem has an added complication, not only does it involve the motion of two objects, the motion of one of them (your car) has to be divided into two parts. The other car has a steady speed of 58.7The student can show that the solution to this equation is T = 10.5 s. Use this value of T to obtain the distance moved by either of the cars which will come out to be 616 ft.
Questions
 Sample Kinematics Problems with Solutions
 Unit Index

